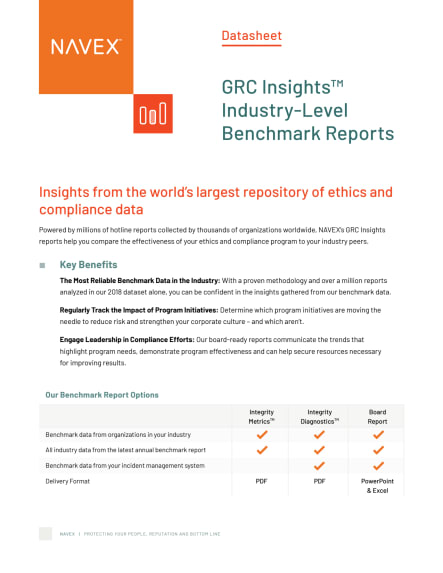
Shape smarter strategies with GRC insights
Stop sifting through data and start solving problems with compliance reporting that puts you in control of your data.
Stop sifting through data and start solving problems with compliance reporting that puts you in control of your data.
Your team’s ability to pivot and progress hinges on using clear and strategic GRC data. With NAVEX GRC Insights, data from across your organization is available in board-ready, standard or custom reports to drive your compliance outcomes.
With it, you will:

Translate whistleblowing metrics and reporting data into dynamic, easy-to-understand reports.
Make disclosures easier to collect and resolve by visualizing patterns across your organization.
Shed light on the complex web of third-party risks with detailed reports that connect and analyze isolated data sources.
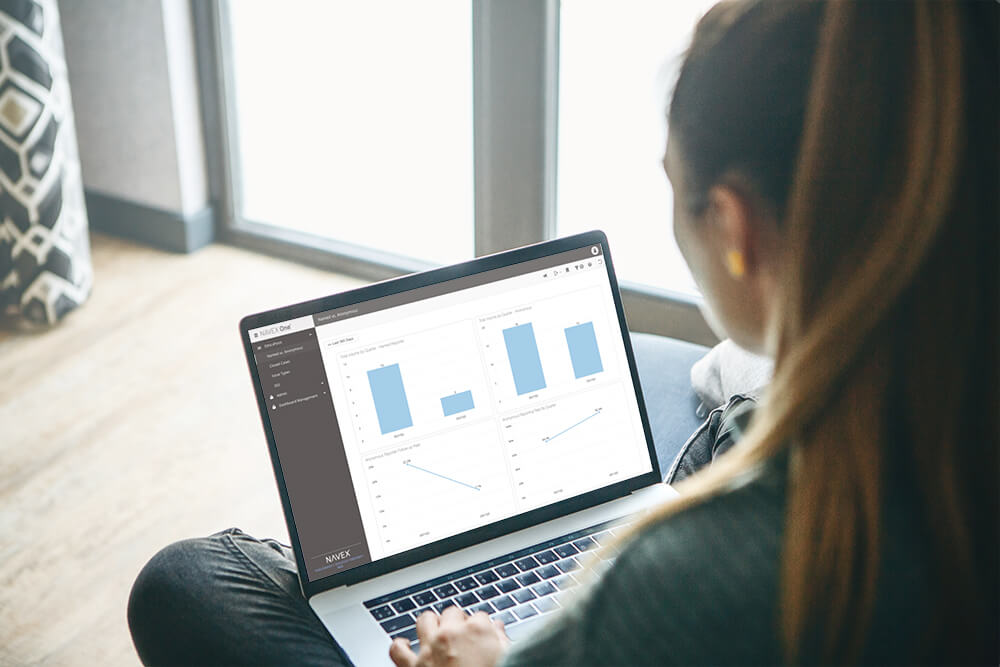
Transform the way you view and interact with your GRC data.
Freshen up raw data by transforming it into an attractive report format for maximum impact.
Streamline collaboration and get the right data to the right people, fast.
These aren’t the data analytics your grandparents grew up with. Check out our additional resources on how GRC insights gives depth and meaning to your internal GRC data.
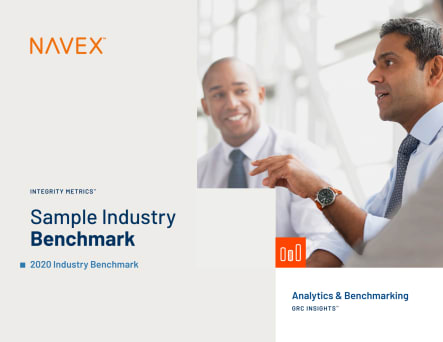
Datasheet
Integrity Metrics Sample Report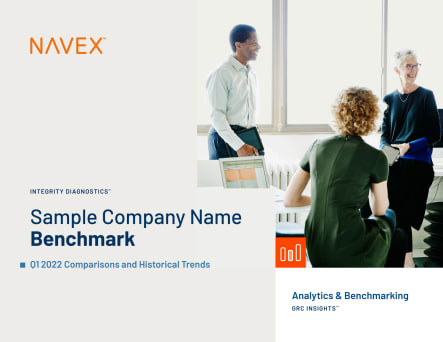
Datasheet
Integrity Diagnostics Sample ReportGo past the surface of the GRC data you collect and inspire action past the raw data. Ready to see the difference a data story makes?